
What is Google Analytics?
The tool allows you to track websites, blogs, and social networks. In addition, it puts at your disposal predetermined and customizable reports. As indicated in its entry in Wikipedia, Analytics “offers grouped information of the traffic that arrives at the websites according to the audience, the acquisition, the behavior, and the conversions carried out on the website.” And also, Google Analytics is the dominant tool. It offers more data and metrics than any other.
It works on elements as varied and vital as the following:
- Number of visits
- Their duration
- Sources of traffic
- Visited pages
It also acts in sections such as:
- Your users preferred sections
- Keywords used
- Technical details of visitors’ devices. That would enter the browsers that users use or their mobile operating systems.
But what makes Analytics a complete tool is that it is compatible with the rest of Google’s tools. Thus, it is possible to combine Analytics with AdWords, Blogger or YouTube. In fact, all Google tools in which visits and traffic are counted can be mixed and complemented with Google Analytics. In addition, there are different attractive resources for Analytics available in Google Chrome. You can play with them too.
History
Google acquired Urchin Software Corp. in April 2005. Google’s service was developed from Urchin on Demand. The system also brings ideas from Adaptive Path, whose product, Measure Map, was acquired and used in the redesign of Google Analytics in 2006. Google continued to sell the standalone, installable Urchin WebAnalytics Software through a network of value-added resellers until discontinuation on March 28, 2012.[16][17] The Google-branded version was rolled out in November 2005 to anyone who wished to sign up. However, due to extremely high demand for the service, new sign-ups were suspended a week later. As capacity was added to the system, Google began using a lottery-type invitation-code model. Before August 2006, Google was sending out batches of invitation codes as server availability permitted; since mid-August 2006 the service has been fully available to all users – whether they use Google for advertising or not.
The newer version of Google Analytics tracking code is known as the asynchronous tracking code, which Google claims is more sensitive and accurate, and is able to track very short activities on the website. The previous version delayed page loading, and so, for performance reasons, it was generally placed just before the </body> body close HTML tag. The new code can be placed between the <head>…</head> HTML head tags because, once triggered, it runs in parallel with page loading. In April 2011 Google announced the availability of a new version of Google Analytics featuring multiple dashboards, more custom report options, and a new interface design. This version was later updated with some other features such as real-time analytics and goal flow charts.
In October 2012 another new version of Google Analytics was announced, called Universal Analytics. The key differences from the previous versions were: cross-platform tracking, flexible tracking code to collect data from any device, and the introduction of custom dimensions and custom metrics.
In March 2016, Google released Google Analytics 360, which is a software suite that provides analytics on return on investment and other marketing indicators. Google Analytics 360 includes seven main products: Analytics, Tag Manager, Optimize, Data Studio, Surveys, Attribution, and Audience Center.
In October 2017 a new version of Google Analytics was announced, called Global Site Tag. Its stated purpose was to unify the tagging system to simplify implementation.
In June 2018, Google introduced Google Marketing Platform, an online advertisement and analytics brand.[27] It consists of two former brands of Google, DoubleClick Digital Marketing and Google Analytics 360.
In October 2020, Google released Google Analytics 4, under the acronym GA4.
How does Google Analytics work?
Google Analytics acquires user data from each website visitor through the use of page tags. A JavaScript page tag is inserted into the code of each page. This tag runs in the web browser of each visitor, collecting data and sending it to one of Google’s data collection servers. Google Analytics can then generate customizable reports to track and visualize data such as the number of users, bounce rates, average session durations, sessions by channel, page views, goal completions and more.
The page tag functions as a web bug or web beacon, to gather visitor information. However, because it relies on cookies, the system can’t collect data for users who have disabled them. Its operation is based on three processes: the collection of data, the processing thereof and the creation of reports. However, to start with the process, as in any strategy you should set some objectives.
Also, although there are three important aspects, to offer you complete information, we will even talk about the configuration.
1. Data Collection
Google Analytics uses a JavaScript code to collect information from websites. In this way, Analytics records a visit each time a user views a page with the Google Analytics code. In the case of applications for mobile devices, it is necessary to add additional an code to each “activity” that you want to track.
In order to understand the data collection process we will explain it step by step:
The server responds by sending the page that is requested to the user’s browser. In this way, once the browser analyzes the data, it will contact other servers that will deal with some parts of the code of that requested page. This is how the Google Analytics Tracking code works.
Next, the user’s browser that visits your page asks that code to Analytics. The platform is sent and saved in a file called Urchin.js. While the code is being executed, the previously commented attributes of the visitor and his navigation are studied.
Once all the data has been collected, the code creates cookies on the visitor’s computer.
When the cookies are already defined, the code sends all that information to the Google Analytics server by requesting an invisible GIF file.
Then save the data in another file called File Logs and create a section of data in it for each page viewed. These data include aspects such as the date and time, the search engine where the visitor comes from, the number of visits, etc.
2.Data Processing
Once the interactions of a user have been collected, Google Analytics begins the data processing to transform the raw data into useful data that gives you knowledge. To process them, each of the data sections is analyzed separately. That is, their attributes are divided.
Google Analytics transforms each attribute into elements that it calls ‘fields’. In this way, for example, the IP address will become the “Visitor’s IP” field. Each section or line provides several attributes, and each of them is stored in different areas.
If you work with Google Analytics every day it is likely that you have faced the definition of the attribution model that helps you extract value from the data. It is very important that you define the model very well, in this way you will improve the results.
3. Settings
Google Analytics applies its settings (for example, filters) to raw data. When the data has been processed, it is stored in a database. Once processed and inserted into the database, it is no longer possible to modify them.
This way you can control how this data appears in the Analytics profiles that you have created in your account.
4. Report generation
The resulting reports can be consulted either from the Google Analytics web service itself, www.google.es/analytics or from other spaces for which it is necessary to use the reporting APIs.
Each report is created based on field comparisons. That is, aspects such as the visitor’s city or its conversion rate are taken into account.
Finally, once the data is stored in the database, the process is terminated.
Google Analytics features
Google Analytics includes features that can help users identify trends and patterns in how visitors engage with their websites. Features enable data collection, analysis, monitoring, visualization, reporting and integration with other applications. These features include:
- data visualization and monitoring tools, including dashboards, scorecards and motion charts that display changes in data over time;
- data filtering, manipulation and funnel analysis;
- data collection application program interfaces (APIs);
- predictive analytics, intelligence and anomaly detection;
- segmentation for analysis of subsets, such as conversions;
- custom reports for advertising, acquisition, audience behavior and conversion;
- email-based sharing and communication; and
- integration with other products, including Google Ads, Google Data Studio, Salesforce Marketing Cloud, Google AdSense, Google Optimize 360, Google Search Ads 360, Google Display & Video 360, Google Ad Manager and Google Search Console.
Within the Google Analytics dashboard, users can save profiles for multiple websites and either see details for default categories or select custom metrics to display for each site. Available categories for tracking include content overview, keywords, referring sites, visitors overview, map overlay and traffic sources overview.
The dashboard can be viewed on the Google Analytics site and is available through a widget or a plugin for embedding into other sites. Customized Google Analytics dashboards are also available from independent vendors.
Important metrics
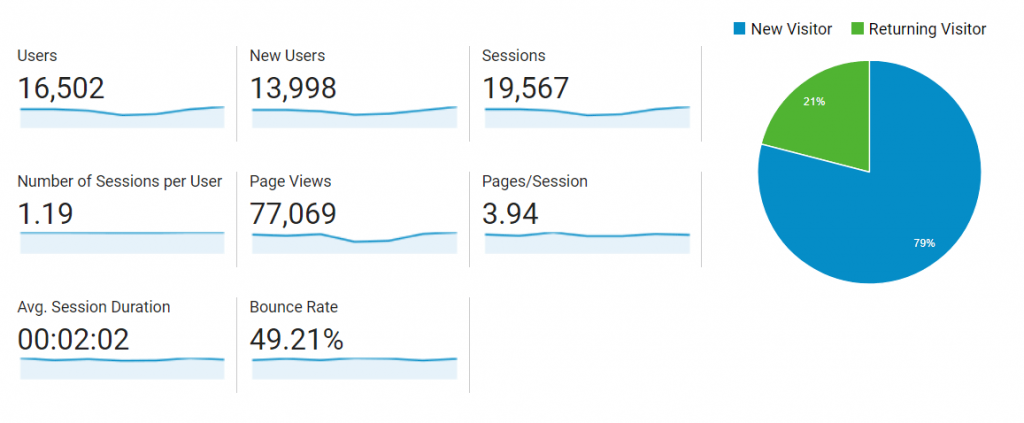
A metric is a standard of quantitative measurement. Google Analytics enables users to track up to 200 different metrics to measure how their websites are performing. While some metrics may be more valuable to certain businesses than others, these are some of the most popular metrics:
- Users. A user is a unique or new visitor to the website.
- Bounce rate. The percentage of visitors who viewed only a single page. These visitors only triggered a single request to the Google Analytics server.
- Sessions. The group of visitor interactions that happen in a 30-minute window of activity.
- Average session duration. How long on average each visitor stays on the site.
- Percentage of new sessions. The percentage of website visits that are first-time visits.
- Pages per session. The average number of page views per each session.
- Goal completions. The number of times visitors complete a specified, desirable action. This is also known as a conversion.
- Page views. Total number of pages viewed.
Metrics vs. dimensions
Google Analytics reports consist of dimensions and metrics. Understanding the difference between them is critical for proper interpretation of reports.
Dimensions. These are qualitative attributes or labels used to describe and organize data. For example, if the average session length is being measured across several different regions, the dimensions would be “Region.” “Average session length,” which is a quantitative measurement, is an example of a metric.
Dimensions can be customized in Google Analytics. Examples of common dimensions include:
- language;
- browser type;
- city and country;
- models of devices; and
- user age group.
Metrics. These are quantitative measurements of a single type of data. Examples of metrics include average session lengths, page views, pages per session and average time on site. Metrics are used to compare measurements across different dimensions.
7 attribution models in Google Analytics
Once you have set a goal, it is important to define the attribution model you are going to use. An attribution model is a system by which you will assign the contribution value to the objective of each of the channels that intervene in the customer experience.
The 7 attribution models that Google Analytics puts at your disposal are:
- Attribution of last interaction: In which 100% of the value of the conversion is attributed to the previous channel with which the client has interacted before making the conversion.
- Last indirect click: In this case, the total of the conversion value is attributed to the previous channel in which the customer has clicked before making the purchase.
- Last click of AdWords: Conversion is granted to the last ad in which the user clicked before making a conversion, regardless of whether or not he had previously clicked on other ads.
- First interaction: The conversion value is completely granted to the first channel with which the customer has interacted
- Linear attribution: Assigns the same credit to each channel interaction until the conversion occurs. Therefore, all points of contact have the same importance.
- Attribution of deterioration of time: A model that has a predetermined duration of 7 days. The point of contact that occurs seven days before the conversion receives half the value of the one that happens on the same day of the conversion. In addition, the value that takes place 14 days before gets a quarter of the attribution. And the action produced 30 days before receives the minimum attribution.
- Attribution according to the position: This is a hybrid model between the last interaction attribution model and that of the first interaction. Instead of attributing all the value to a single interaction, the one between the two is divided.
Google Analytics 4
Google Analytics 4, or GA4 is the most recent iteration of this service and was released in October 2020. GA4 is somewhat of an overhaul of previous versions of Google Analytics. It offers a completely new user interface and shifts from reliance on third-party cookies toward the use of machine learning for better data accuracy.
Features that are new in Google Analytics 4 include:
- machine learning and artificial intelligence (AI) tools;
- deeper integration with Google Ads;
- customer-centric reporting designed around lifecycle data;
- additional codeless tracking features that can provide data with less latency; and
- enhanced data control features for regulatory compliance and data management.